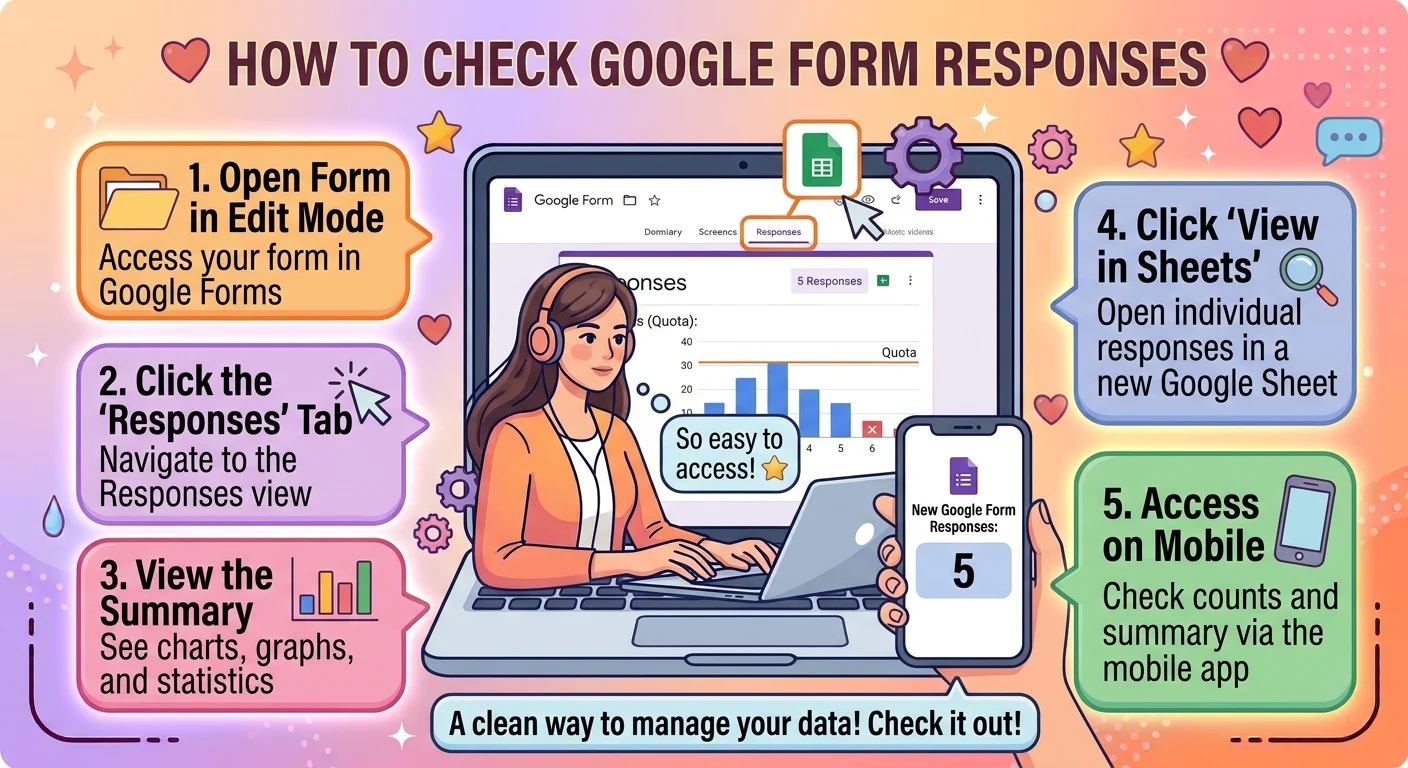
To check Google Form responses, open your form and click the Responses tab, then hit View in Sheets to see every submission in a spreadsheet. The fastest options are the Responses summary view, View in Sheets, the three dot download menu, the Forms mobile app, and email notifications for new entries.
You spent an hour building the perfect Google Form, sent it out to the group chat, and now you’re staring at your screen wondering where all those answers actually went. Maybe it’s a work survey, a friend’s birthday RSVP, or a client intake form, and suddenly you need to know how to check Google Form responses without clicking around for twenty minutes.
Here’s the good news: Google tucked your answers into a tidy little Responses tab that most people never notice. Once you know where to look, checking submissions takes about three seconds, whether you’re on a laptop at midnight or on your phone between meetings. The trick is knowing which view to use and when.
This guide breaks down 180+ ways to check, read, export, and organize your responses, sorted by situation and personality. Bookmark it, screenshot it, send it to the coworker who keeps asking.
Quick and Easy Methods to Check Google Form Responses
• Open your form and tap the Responses tab.
Example: When you need a fast headcount right before a meeting starts.
Meaning: This is the fastest built in way to see every submission at a glance.
• Click the green Sheets icon to open your answers in a spreadsheet.
Example: When you want to sort, filter, or share answers with someone else.
Meaning: It creates a live linked spreadsheet that updates automatically.
• Hit the three dot menu and choose Download responses.
Example: When you need an offline copy for a report or presentation.
Meaning: It saves all answers as a CSV file you can open anywhere.
• Use the Summary view to see instant charts.
Example: When you need a quick visual of how people answered.
Meaning: It turns raw answers into graphs without any extra work.
• Switch to Question view to read answers one question at a time.
Example: When you’re scanning open ended feedback and want to stay focused.
Meaning: It groups every answer under its question for easier reading.
• Switch to Individual view to read one person’s full submission.
Example: When you need to follow up with a specific respondent.
Meaning: It shows each person’s complete set of answers on one screen.
• Check the Accepting responses toggle to confirm your form is live.
Example: When submissions suddenly stop and you’re not sure why.
Meaning: It tells you instantly whether the form is still collecting answers.
• Glance at the response count under the Responses tab.
Example: When someone asks how many people filled it out so far.
Meaning: It gives you a live total without opening anything else.
• Open the Google Forms app for a quick check on your phone.
Example: When you’re out and about and just need a number.
Meaning: It gives you the essential views without a laptop.
• Search your Gmail for the form notification email.
Example: When you forgot where the form lives but remember getting an alert.
Meaning: It leads you straight back to the form and its responses.
• Open the linked Google Sheet directly from Google Drive.
Example: When you’d rather skip the form and go straight to the data.
Meaning: It saves you a couple of clicks if the Sheet is already in your Drive.
• Bookmark the response Sheet link so future checks take one click.
Example: When you check answers every single day for a project.
Meaning: It removes the repeated navigation and saves you time.
Professional Work Mode Methods
• Share the response Sheet with your team using view only access.
Example: When multiple people need visibility but nobody should edit.
Meaning: It keeps your data safe while keeping everyone informed.
• Set up a filter view in Sheets for each department.
Example: When responses come from different teams and you need clean slices.
Meaning: It lets each person see only the rows relevant to them.
• Export a PDF summary for stakeholder updates.
Example: When leadership wants a polished snapshot before a review.
Meaning: It presents the data cleanly without exposing the raw spreadsheet.
• Use Sheets version history to track changes over time.
Example: When someone accidentally deletes a row and you need it back.
Meaning: It gives you a full audit trail and a quick undo option.
• Build a pivot table for department level totals.
Example: When you need counts and averages grouped by category.
Meaning: It summarizes large volumes of responses in seconds.
• Turn on email notifications for new responses.
Example: When you want to know the moment a client submits an inquiry.
Meaning: It keeps you responsive without constantly refreshing the page.
• Check the timestamp column against your deadline.
Example: When you need to confirm submissions arrived on time.
Meaning: It gives you proof of when each response came in.
• Protect the Sheet from accidental edits before sharing it widely.
Example: When a large group will open the file.
Meaning: It prevents someone from wiping data with a stray keystroke.
• Use conditional formatting to flag incomplete answers.
Example: When required fields might have been skipped.
Meaning: It highlights gaps visually so nothing slips through.
• Build a dashboard tab with key metrics pinned on top.
Example: When you present findings weekly to the same audience.
Meaning: It gives you one screen that answers the most common questions.
• Schedule a weekly export so you always have a backup.
Example: When the data matters and you can’t risk losing it.
Meaning: It creates a safety net and a historical record.
• Keep a master Sheet and a separate working copy.
Example: When you clean and manipulate data frequently.
Meaning: It protects the original responses from any edits you make.
Beginner Friendly Methods
• Open Google Forms and sign in with the same account you used to build the form.
Example: When you can’t find your form anywhere.
Meaning: It confirms you’re looking in the right account.
• Look for your form on the Google Forms home screen under Recent forms.
Example: When you built it a while ago and forgot the title.
Meaning: It helps you locate the form without needing a link.
• Click the Responses tab at the top of the form editor.
Example: When you’re inside the form and don’t see any answers.
Meaning: It reveals all the submission views in one place.
• Read the Summary view first if you’re brand new to this.
Example: When you want a gentle overview instead of a wall of data.
Meaning: It shows simple charts that are easy to interpret.
• Use the Question view to read written answers slowly.
Example: When you need to understand feedback in people’s own words.
Meaning: It keeps long form answers organized by question.
• Click Individual to see what one person submitted.
Example: When you need to check a single respondent’s details.
Meaning: It removes the overwhelm of seeing everyone at once.
• Press View in Sheets only when you’re ready to work with the data.
Example: When you’ve reviewed the summary and now need the full picture.
Meaning: It creates a spreadsheet you can sort and filter.
• Ignore the empty columns at the far right of the Sheet.
Example: When your Sheet looks wider than expected.
Meaning: It stops you from worrying about blank cells that don’t matter.
• Use the Find feature to search for a name or email.
Example: When you know someone submitted and want to confirm quickly.
Meaning: It saves scrolling through hundreds of rows.
• Check the top row of the Sheet to understand what each column means.
Example: When the sheet feels confusing at first glance.
Meaning: It maps every answer back to its original question.
• Use the Freeze option to lock the header row in place.
Example: When you’re scrolling and lose track of which column is which.
Meaning: It keeps your labels visible at all times.
• Take a screenshot of the summary before you start editing anything.
Example: When you want a simple record of the original state.
Meaning: It gives you a safe reference point.
Mobile and On the Go Methods
• Download the Google Forms app for quick access anywhere.
Example: When you’re traveling and need to check submissions.
Meaning: It puts the essential views right in your pocket.
• Open the form in your mobile browser and tap the Responses tab.
Example: When you don’t want to install another app.
Meaning: It gives you full access without a download.
• Use the Sheets mobile app to view the linked spreadsheet.
Example: When you need to scroll through answers on your commute.
Meaning: It lets you read and filter data on a small screen.
• Pin the form to your home screen for one tap access.
Example: When you check responses several times a day.
Meaning: It cuts out the search step entirely.
• Rotate your phone to landscape for easier chart viewing.
Example: When the summary graphs feel cramped.
Meaning: It gives you more screen space for reading visuals.
• Use the mobile Sheets search bar to find a specific answer.
Example: When you need to confirm one person’s submission fast.
Meaning: It helps you locate a row in seconds.
• Enable notifications in the Forms app for new responses.
Example: When you want a ping instead of constant checking.
Meaning: It keeps you updated passively.
• Screenshot key numbers from the Summary view for quick sharing.
Example: When someone asks for the count in a group chat.
Meaning: It gives you a fast answer without opening a laptop.
• Open the linked Sheet from the Drive app if you’re already there.
Example: When you’re organizing files and want a quick peek.
Meaning: It saves a step if you’re already in Drive.
• Use voice search to find your form by name.
Example: When you’re walking and can’t type easily.
Meaning: It gets you to the form hands free.
• Check responses during small breaks instead of one big session.
Example: When you’re managing a live event.
Meaning: It keeps you responsive without blocking your day.
• Refresh the Summary view to see newly added answers.
Example: When responses are coming in fast during a launch.
Meaning: It ensures you’re looking at the latest numbers.
Data Nerd Analytical Methods
• Sort the Sheet by timestamp to see responses in order.
Example: When you need to know who replied first.
Meaning: It puts submissions into a clean chronological sequence.
• Filter by a specific question to isolate one group.
Example: When you want only responses from one department or city.
Meaning: It narrows your dataset to exactly what you need.
• Create a pivot table to summarize large volumes.
Example: When you have hundreds of rows and need quick totals.
Meaning: It converts raw answers into digestible summaries.
• Use COUNTIF formulas to tally specific answers.
Example: When you need an exact count of people who said yes.
Meaning: It gives you precise numbers without manual counting.
• Add a helper column to categorize open ended answers.
Example: When written responses need tagging for analysis.
Meaning: It makes qualitative data sortable and comparable.
• Calculate averages for rating scale questions.
Example: When you need a single satisfaction number.
Meaning: It turns scattered scores into one clear figure.
• Build charts from pivot data for your report.
Example: When numbers need to become visuals for a deck.
Meaning: It makes your findings easier to communicate.
• Check for duplicate entries using conditional formatting.
Example: When someone might have submitted twice.
Meaning: It flags repeat rows so you can clean your data.
• Use the SPLIT function for multi select answers.
Example: When people chose several options in one question.
Meaning: It separates combined answers into usable pieces.
• Cross reference two questions to find patterns.
Example: When you want to know if one group answered differently.
Meaning: It reveals relationships that a single column can’t show.
• Export to CSV and open it in a dedicated analysis tool.
Example: When the dataset is too big for a browser tab.
Meaning: It gives you more computing power for heavy analysis.
• Keep a summary tab that pulls key metrics automatically.
Example: When you check the same numbers repeatedly.
Meaning: It turns a manual process into a self updating view.
Teacher and Classroom Methods
• Open the Responses tab and switch to Individual view to grade one student at a time.
Example: When reviewing quiz submissions after class.
Meaning: It keeps each student’s answers together for fair grading.
• Link responses to Google Sheets and add a score column.
Example: When you want to track marks over several assignments.
Meaning: It creates a reusable grading sheet.
• Filter the Sheet by student email to find late submissions.
Example: When you need to check who missed the deadline.
Meaning: It isolates each student’s entry quickly.
• Use the timestamp to verify submission times.
Example: When deadlines matter and you need proof.
Meaning: It gives you an exact record of when work arrived.
• Sort by name to review answers alphabetically.
Example: When entering grades into a roster.
Meaning: It makes matching students to marks faster.
• Check the Summary view for question level insight.
Example: When most of the class got one question wrong.
Meaning: It highlights topics that need reteaching.
• Export a CSV for your school’s gradebook system.
Example: When you need to import scores elsewhere.
Meaning: It moves your data without retyping anything.
• Share a view only Sheet with a co teacher.
Example: When two people are grading the same assignment.
Meaning: It keeps everyone on the same page.
• Use conditional formatting to highlight low scores.
Example: When you want to spot struggling students fast.
Meaning: It draws your eye to the entries that need attention.
• Add a notes column for parent communication.
Example: When you track follow ups alongside results.
Meaning: It keeps comments and scores in one place.
• Set up email notifications for late submissions.
Example: When you want to catch missed work early.
Meaning: It helps you follow up without daily checking.
• Keep a separate Sheet per class period.
Example: When multiple sections use the same form.
Meaning: It prevents mixing students from different groups.
Event Planner Methods
• Open the Summary view to check your RSVP count.
Example: When the caterer needs final numbers.
Meaning: It gives you a live headcount in one glance.
• Sort by attendance answer to separate yes from maybe.
Example: When you need to chase down undecided guests.
Meaning: It creates a clear follow up list.
• Filter by dietary restrictions before ordering food.
Example: When you’re finalizing the menu.
Meaning: It surfaces every relevant answer in seconds.
• Check timestamps to identify late RSVPs.
Example: When someone asks if they still made the cut.
Meaning: It gives you a clear record of when people replied.
• Export to CSV and share with your vendor.
Example: When the venue needs the guest list.
Meaning: It delivers clean data in a format anyone can open.
• Use Individual view to confirm one guest’s full details.
Example: When someone texts asking what you have on file.
Meaning: It lets you answer precisely without guessing.
• Add a checkbox column in Sheets for confirmed attendance.
Example: When you need to track who actually showed up.
Meaning: It turns your form data into a live checklist.
• Set email notifications so new RSVPs don’t slip by.
Example: When responses keep trickling in close to the date.
Meaning: It keeps you updated without manual refreshing.
• Create a filtered view for plus ones.
Example: When final numbers depend on guests bringing someone.
Meaning: It separates headcount from main guests.
• Check the response count against your invite list.
Example: When you need to know who hasn’t replied yet.
Meaning: It shows the gap between invited and confirmed.
• Download the Sheet as a PDF for your event folder.
Example: When you want a printable backup.
Meaning: It gives you an offline copy for the day of the event.
• Share a view only link with your co host.
Example: When someone else is handling logistics.
Meaning: It keeps both of you looking at the same numbers.
Small Business Owner Methods
• Open the Responses tab daily to catch new inquiries.
Example: When your form doubles as a lead capture tool.
Meaning: It keeps you from missing potential customers.
• Turn on email notifications for every new submission.
Example: When fast replies win you business.
Meaning: It shortens your response time significantly.
• Link responses to Sheets and add a status column.
Example: When you track leads from new to closed.
Meaning: It turns a form into a lightweight CRM.
• Filter by service type to route inquiries correctly.
Example: When different offerings need different follow ups.
Meaning: It helps you prioritize the right leads.
• Export monthly CSVs for your bookkeeping.
Example: When orders or requests need a paper trail.
Meaning: It gives you clean records for accounting.
• Use conditional formatting to flag high value requests.
Example: When a big order comes through.
Meaning: It makes important submissions impossible to miss.
• Search the Sheet by email to check a repeat customer.
Example: When someone asks if you already have their details.
Meaning: It saves time and looks professional.
• Protect the master Sheet and work from a copy.
Example: When you clean data for marketing.
Meaning: It keeps your original submissions untouched.
• Add a notes column for call outcomes.
Example: When you follow up by phone.
Meaning: It keeps your pipeline organized.
• Review the Summary view monthly for trends.
Example: When you want to see what customers ask for most.
Meaning: It turns your form into free market research.
• Share a filtered view with your assistant or VA.
Example: When someone else handles initial replies.
Meaning: It gives them only what they need.
• Back up your Sheet at the end of each month.
Example: When your data drives your business decisions.
Meaning: It protects you from accidental loss.
Freelancer and Client Methods
• Check the Responses tab right after sending a client form.
Example: When you want to start work the moment details arrive.
Meaning: It shortens the gap between briefing and delivery.
• Set notifications so you never miss a project brief.
Example: When clients fill forms at odd hours.
Meaning: It keeps your response time looking sharp.
• Export each client’s responses to their own Sheet.
Example: When you manage several projects at once.
Meaning: It keeps data separated and easy to reference.
• Use Individual view to pull one client’s full brief.
Example: When you need every answer in one place.
Meaning: It saves you from hunting through columns.
• Add a project status column in Sheets.
Example: When tracking several briefs at different stages.
Meaning: It gives you a simple project tracker.
• Filter by deadline question to plan your week.
Example: When multiple projects have tight turnarounds.
Meaning: It helps you sequence work realistically.
• Download a PDF copy for your client folder.
Example: When you need documentation of the original brief.
Meaning: It protects you if scope questions come up later.
• Share a view only Sheet with the client for transparency.
Example: When they want to see submissions from their team.
Meaning: It builds trust without giving edit access.
• Search for specific keywords in open ended answers.
Example: When you need to find a detail buried in feedback.
Meaning: It saves you from reading everything line by line.
• Keep a template Sheet for repeat projects.
Example: When you run the same intake form often.
Meaning: It speeds up your setup every time.
• Check timestamps when billing for time sensitive work.
Example: When a project needs an approval trail.
Meaning: It gives you a clear record of when things came in.
• Archive completed client Sheets into a labeled folder.
Example: When your Drive gets crowded.
Meaning: It keeps your workspace clean and searchable.
Team Lead and Manager Methods
• Share the response Sheet with your team in view only mode.
Example: When everyone needs visibility but not editing power.
Meaning: It protects data integrity while keeping people informed.
• Create filtered views for each team member.
Example: When different people own different sections.
Meaning: It reduces confusion and duplicated work.
• Set up notifications so leads see new submissions instantly.
Example: When response speed affects customer satisfaction.
Meaning: It keeps the team reactive without manual checks.
• Build a summary tab with weekly metrics.
Example: When you report progress in standups.
Meaning: It gives you consistent numbers to reference.
• Use conditional formatting to flag escalations.
Example: When certain answers need immediate attention.
Meaning: It routes urgent items to the right person.
• Export a CSV for your reporting tool.
Example: When leadership wants data in a specific system.
Meaning: It bridges your form data with your analytics stack.
• Check for duplicate submissions before counting results.
Example: When someone might have filled the form twice.
Meaning: It keeps your numbers accurate.
• Add an owner column to assign follow ups.
Example: When each response needs a named person responsible.
Meaning: It creates clear accountability.
• Protect the master Sheet from accidental edits.
Example: When many people access the same file.
Meaning: It prevents costly mistakes.
• Review the Summary view before each team meeting.
Example: When you need a quick status update.
Meaning: It gives you talking points without prep time.
• Keep an archive of past response Sheets.
Example: When you need historical comparisons.
Meaning: It lets you spot trends over time.
• Document your Sheet structure so the team can maintain it.
Example: When someone new joins the project.
Meaning: It makes handovers painless.
Chill and Casual Methods
• Just tap the Responses tab and see what’s there.
Example: When you’re curious and not in a rush.
Meaning: It gives you a relaxed overview without overthinking.
• Peek at the Summary charts for a quick vibe check.
Example: When you want the gist, not the details.
Meaning: It shows you the big picture instantly.
• Open the Sheet whenever you feel like scrolling.
Example: When responses are trickling in slowly.
Meaning: It lets you browse at your own pace.
• Skim the newest rows at the bottom of the Sheet.
Example: When you just want to see recent submissions.
Meaning: It focuses you on what’s fresh.
• Use Individual view to read one person at a time.
Example: When you don’t want to be overwhelmed.
Meaning: It keeps things bite sized.
• Check responses once a day instead of constantly.
Example: When you’re trying not to obsess over numbers.
Meaning: It protects your peace of mind.
• Screenshot the count and send it to whoever asked.
Example: When someone in the group chat needs an update.
Meaning: It answers the question in two seconds.
• Search by name when you only care about one person.
Example: When a friend asks if their form went through.
Meaning: It gets you the answer without scanning everything.
• Let notifications do the checking for you.
Example: When you’d rather be pinged than refresh.
Meaning: It removes the manual effort entirely.
• Open the Sheet on your phone during a coffee break.
Example: When you have two minutes and want a quick look.
Meaning: It fits checking into your natural routine.
• Ignore the advanced features until you actually need them.
Example: When a simple glance is enough.
Meaning: It keeps things easy and low pressure.
• Bookmark the link so future checks are effortless.
Example: When you know you’ll be back tomorrow.
Meaning: It removes friction from a recurring task.
Confident Power User Methods
• Go straight to the linked Sheet and skip the form entirely.
Example: When you already know exactly where your data lives.
Meaning: It saves clicks for people who check often.
• Build a custom dashboard tab with formulas pulling key answers.
Example: When you want your numbers ready before you ask.
Meaning: It turns a form into a self updating report.
• Set up QUERY formulas to filter responses automatically.
Example: When you need a live view of one segment.
Meaning: It keeps your analysis current without manual filtering.
• Use ARRAYFORMULA to apply logic to all rows at once.
Example: When new responses keep arriving.
Meaning: It keeps your calculations consistent as data grows.
• Create an automated email summary using Sheet triggers.
Example: When you want a digest without checking.
Meaning: It delivers insights straight to your inbox.
• Protect and lock critical cells before sharing widely.
Example: When you’re handing the Sheet to a large group.
Meaning: It keeps your structure safe from edits.
• Use named ranges to keep formulas readable.
Example: When your formulas get long and complex.
Meaning: It makes your Sheet easier to maintain.
• Build a separate analysis tab that never touches raw data.
Example: When you need clean outputs and safe originals.
Meaning: It separates working data from source data.
• Set up data validation on the Sheet to keep entries clean.
Example: When you’re adding manual notes alongside responses.
Meaning: It prevents messy inputs from breaking your analysis.
• Use IMPORTRANGE to pull responses into a master workbook.
Example: When you manage multiple forms at once.
Meaning: It centralizes your data automatically.
• Automate weekly CSV exports with a scheduled script.
Example: When you need regular backups without remembering.
Meaning: It removes the risk of human forgetfulness.
• Keep a changelog tab documenting every structural update.
Example: When multiple people maintain the Sheet over time.
Meaning: It preserves clarity as the project evolves.
Clever Shortcut Methods
• Bookmark the exact Sheet URL instead of the form URL.
Example: When checking responses is a daily habit.
Meaning: It cuts one navigation step every single time.
• Use Ctrl plus F in the Sheet to find anything instantly.
Example: When you’re looking for a specific name or phrase.
Meaning: It saves minutes of scrolling.
• Add a filter to the header row once and reuse it forever.
Example: When you check the same segments repeatedly.
Meaning: It turns repeated filtering into a one click habit.
• Pin the Sheet in your browser tab bar.
Example: When you reference it throughout the day.
Meaning: It makes the data permanently one click away.
• Create a saved view for the columns you actually read.
Example: When the Sheet has more columns than you need.
Meaning: It removes visual clutter permanently.
• Use keyboard shortcuts to jump between the form and Sheet.
Example: When you toggle back and forth constantly.
Meaning: It speeds up your workflow noticeably.
• Set your Sheet to open in a specific tab by default.
Example: When you always start with the summary.
Meaning: It removes unnecessary navigation.
• Duplicate your filter setup into a template Sheet.
Example: When you run the same form every month.
Meaning: It saves you from rebuilding the same views.
• Use the Sheets search bar instead of browser find.
Example: When you need to search within formulas too.
Meaning: It searches more thoroughly than the browser tool.
• Group columns you rarely use so they collapse.
Example: When your Sheet feels visually overwhelming.
Meaning: It keeps your working area clean.
• Set the header row to freeze so labels never scroll away.
Example: When you’re reading long lists of answers.
Meaning: It keeps context visible at all times.
• Save a copy of your analysis tab as a reusable template.
Example: When you analyze the same type of form often.
Meaning: It turns repeated work into a quick copy paste.
Creative Customization Methods
• Color code rows using conditional formatting by response type.
Example: When you want visual cues while scanning answers.
Meaning: It makes patterns obvious at a glance.
• Add emoji to your header labels for quick recognition.
Example: When the Sheet has many similar sounding columns.
Meaning: It makes navigation faster and more fun.
• Build a mini summary card at the top of the Sheet.
Example: When you want the important numbers before the details.
Meaning: It gives you a snapshot before scrolling.
• Create a separate tab just for standout feedback.
Example: When some answers deserve extra attention.
Meaning: It highlights the responses that matter most.
• Use sparkline charts to show trends beside each row.
Example: When tracking scores over time.
Meaning: It adds visual context without a full chart.
• Design a simple dashboard with large key numbers.
Example: When you present findings to non data people.
Meaning: It makes the insights impossible to miss.
• Add a notes column for your own commentary.
Example: When you want to annotate responses as you read.
Meaning: It turns a raw list into a working document.
• Create a formatted printable view for offline reference.
Example: When you need a paper copy for a meeting.
Meaning: It makes your data presentable anywhere.
• Use data bars in cells to visualize rating answers.
Example: When scores need to be compared instantly.
Meaning: It adds visual weight to numbers.
• Group related questions into labeled sections in the Sheet.
Example: When your form covers several topics.
Meaning: It brings structure to the raw data.
• Add a tab for ideas inspired by the responses.
Example: When feedback sparks new plans.
Meaning: It connects your data to your next move.
• Keep a style guide tab so the Sheet stays consistent.
Example: When multiple people add columns over time.
Meaning: It keeps your formatting clean as the project grows.
Detail Obsessed Accuracy Methods
• Cross check the response count against the Sheet row count.
Example: When you need to confirm nothing was lost.
Meaning: It verifies your data is complete.
• Scan for blank cells in required columns.
Example: When some submissions may be incomplete.
Meaning: It catches gaps before they cause problems.
• Use conditional formatting to highlight duplicate entries.
Example: When the same person might have filled the form twice.
Meaning: It keeps your numbers clean and reliable.
• Verify timestamps are in the correct time zone.
Example: When deadlines depend on exact submission times.
Meaning: It prevents disputes over late entries.
• Check that all columns match your original questions.
Example: When you edited the form after sending it.
Meaning: It confirms no answers landed in the wrong place.
• Compare the Summary view totals with your Sheet totals.
Example: When numbers seem inconsistent.
Meaning: It validates that both views agree.
• Look for test submissions from yourself and delete them.
Example: When you tested the form before sharing.
Meaning: It keeps your final data clean.
• Confirm the form is still accepting responses if numbers stall.
Example: When submissions stop unexpectedly.
Meaning: It rules out a simple technical cause.
• Spot check three random rows against the original answers.
Example: When you want confidence in your data.
Meaning: It quickly confirms nothing got scrambled.
• Keep a version history note when you clean data.
Example: When you edit or delete rows.
Meaning: It preserves accountability and traceability.
• Review open ended answers for obvious spam entries.
Example: When a form was shared publicly.
Meaning: It protects the quality of your results.
• Back up the Sheet before making structural changes.
Example: When you’re about to add formulas or filters.
Meaning: It gives you a safe point to return to.
FAQs
What does “check Google Form responses” actually mean?
It means opening the Responses tab in your form or the linked Google Sheet to see what people submitted. That’s it. No complicated setup required.
Where do Google Form responses go by default?
They stay inside the form under the Responses tab until you click View in Sheets. Once you link a Sheet, every new answer lands there automatically.
Can I check responses without creating a spreadsheet?
Yes. The Summary and Individual views inside the form show your answers without any Sheet at all. The Sheet is only needed for sorting and exporting.
Do responses update in real time?
Yes, the Sheet updates as people submit. The form’s Summary view may need a refresh to show the newest numbers.
What if I don’t see any responses?
Check that the form is still accepting responses, that you’re signed into the correct account, and that the form was actually shared with the right people.
Can I recover responses I accidentally deleted?
Sometimes. Check the Sheet’s version history, which keeps past states you can restore. It’s the fastest way back.
Is it appropriate to share responses with others?
Only with people who need them. Use view only access and avoid sharing raw data publicly, especially if it contains personal details.
Can I make checking responses more fun or less stressful?
Absolutely. Set notifications so you don’t have to keep looking, and use conditional formatting to make the Sheet easier on the eyes. Small tweaks make a big difference.
Conclusion
Checking Google Form responses doesn’t have to be a mystery hunt through menus. Whether you’re a teacher grading quizzes, a planner counting RSVPs, or just someone who sent out a survey and got nervous, the Responses tab and its linked Sheet have everything you need. Pick the method that matches your mood and your moment, whether that’s a quick mobile glance or a full analytical deep dive.
The more comfortable you get with these views, the faster you’ll spot patterns and act on them. Save this guide, share it with the person on your team who keeps asking where the answers went, and come back whenever a new form goes live. You’ve got this, and your next response check will take about three seconds.
